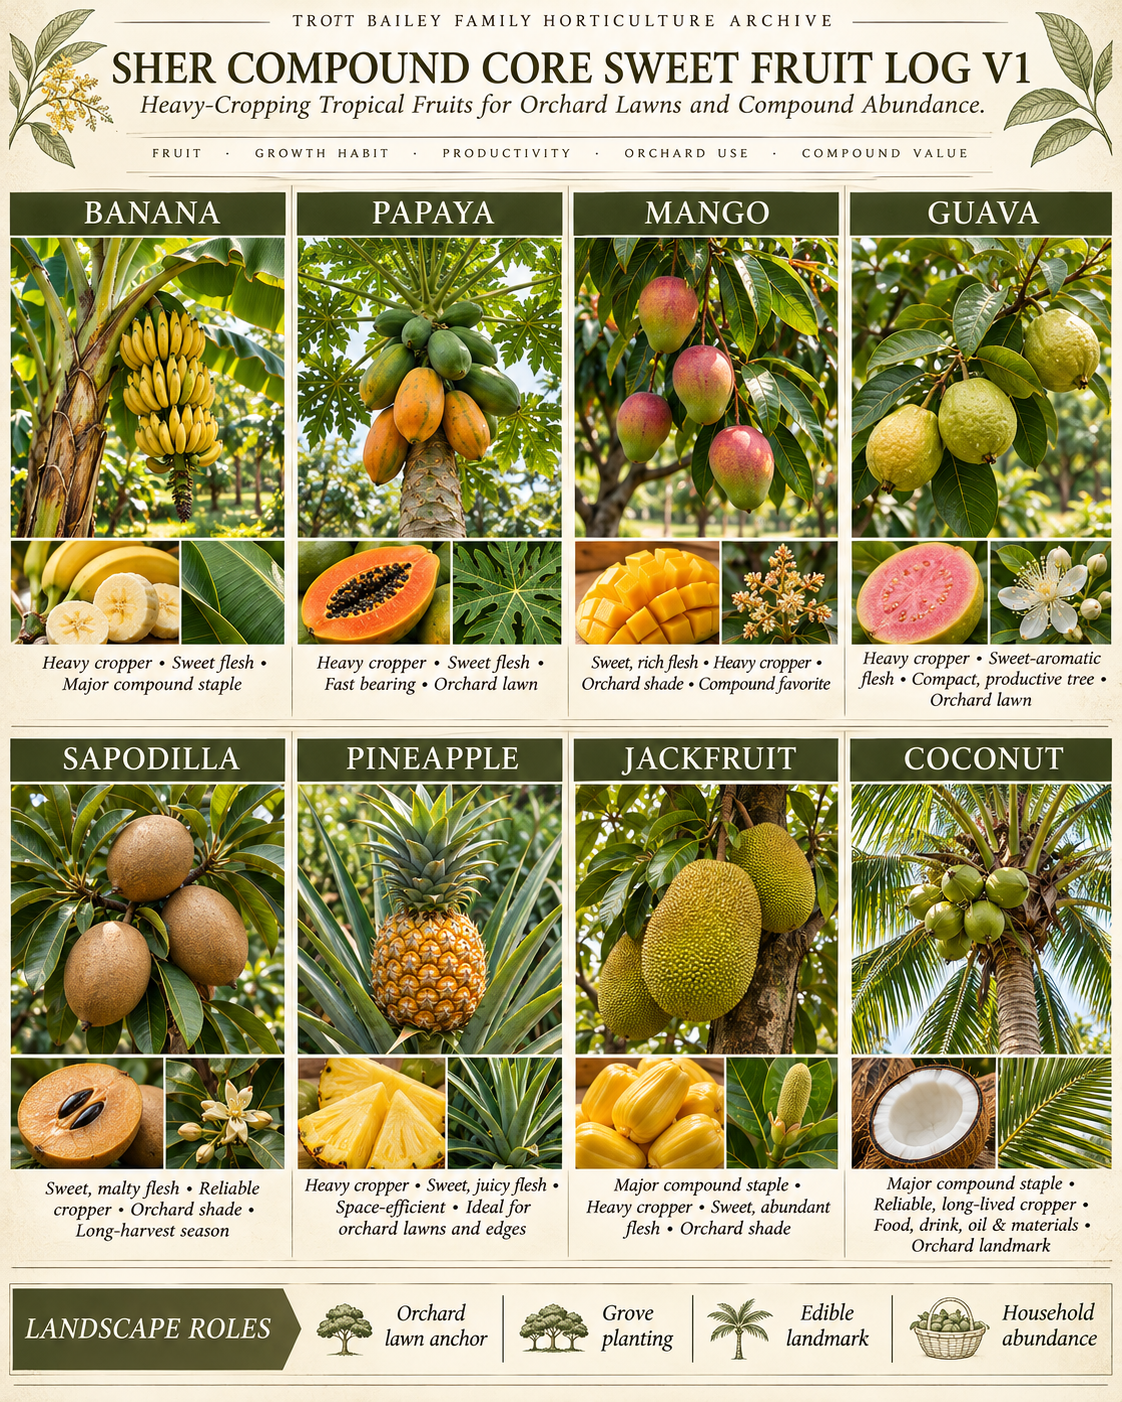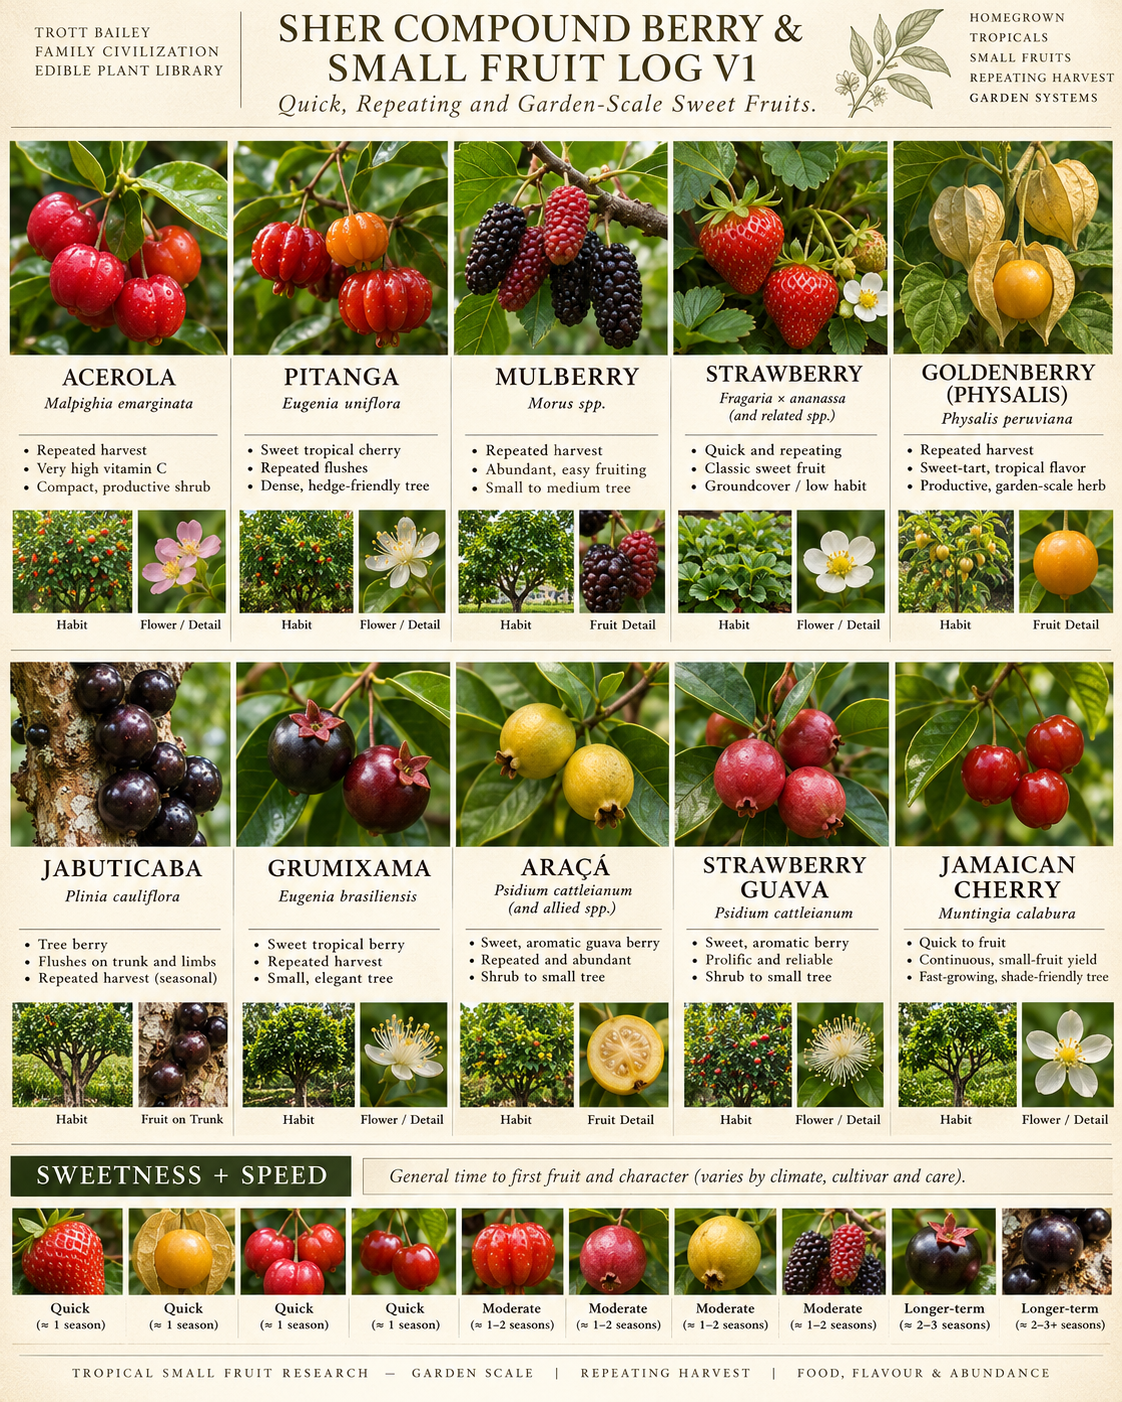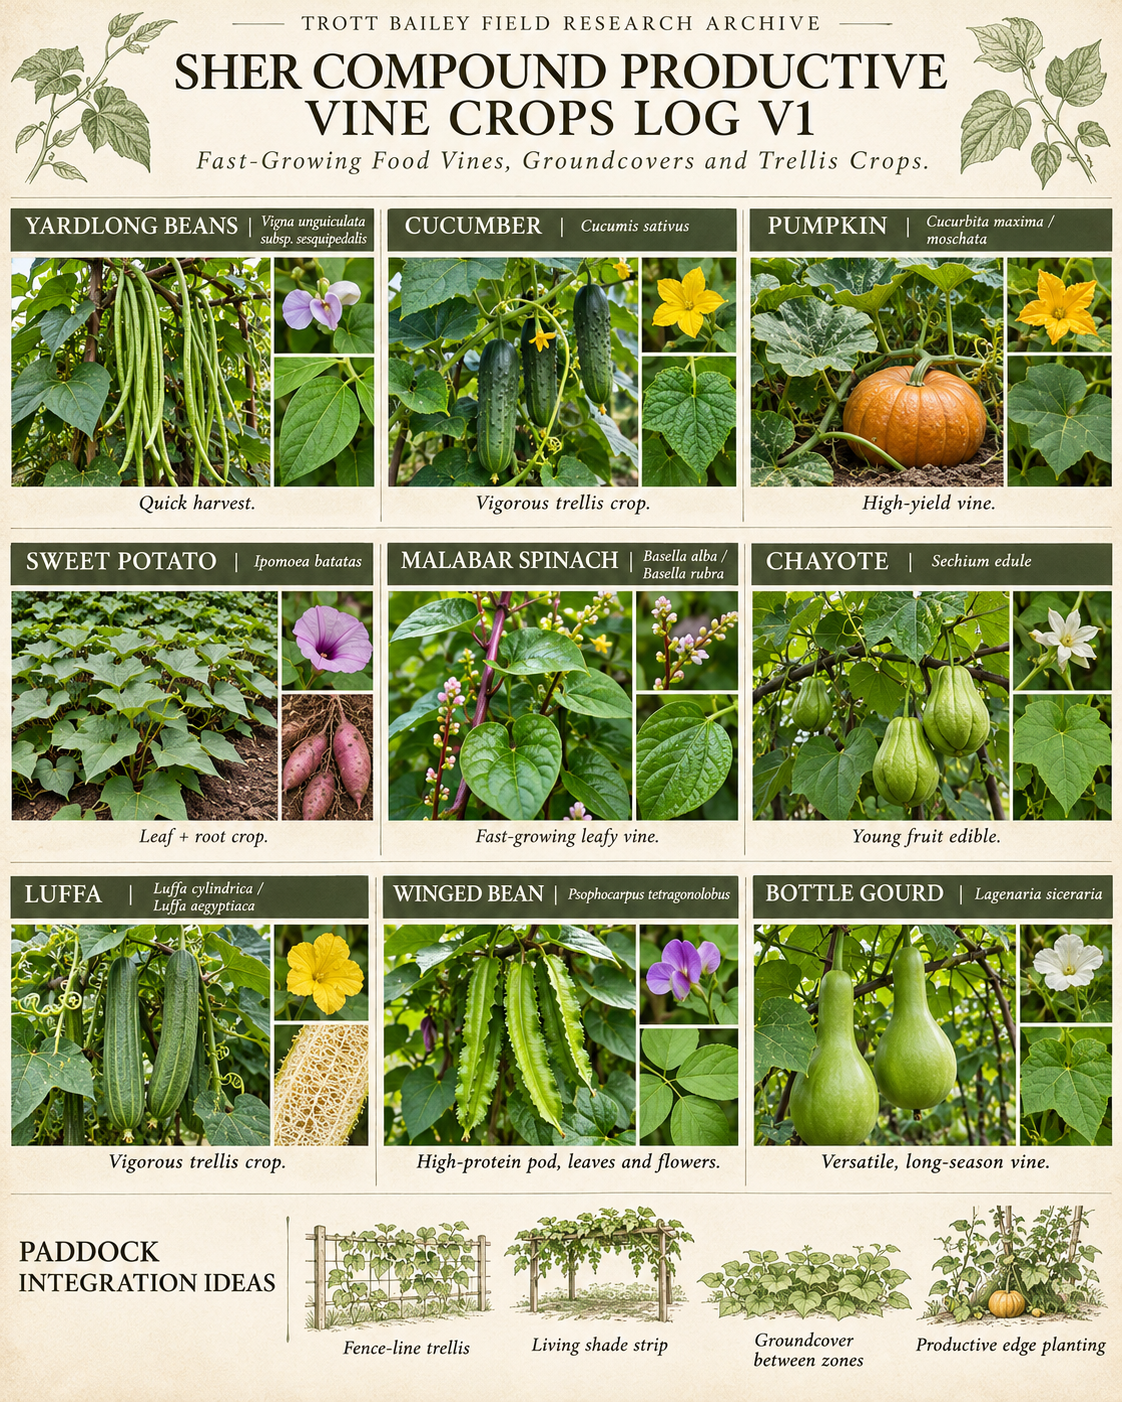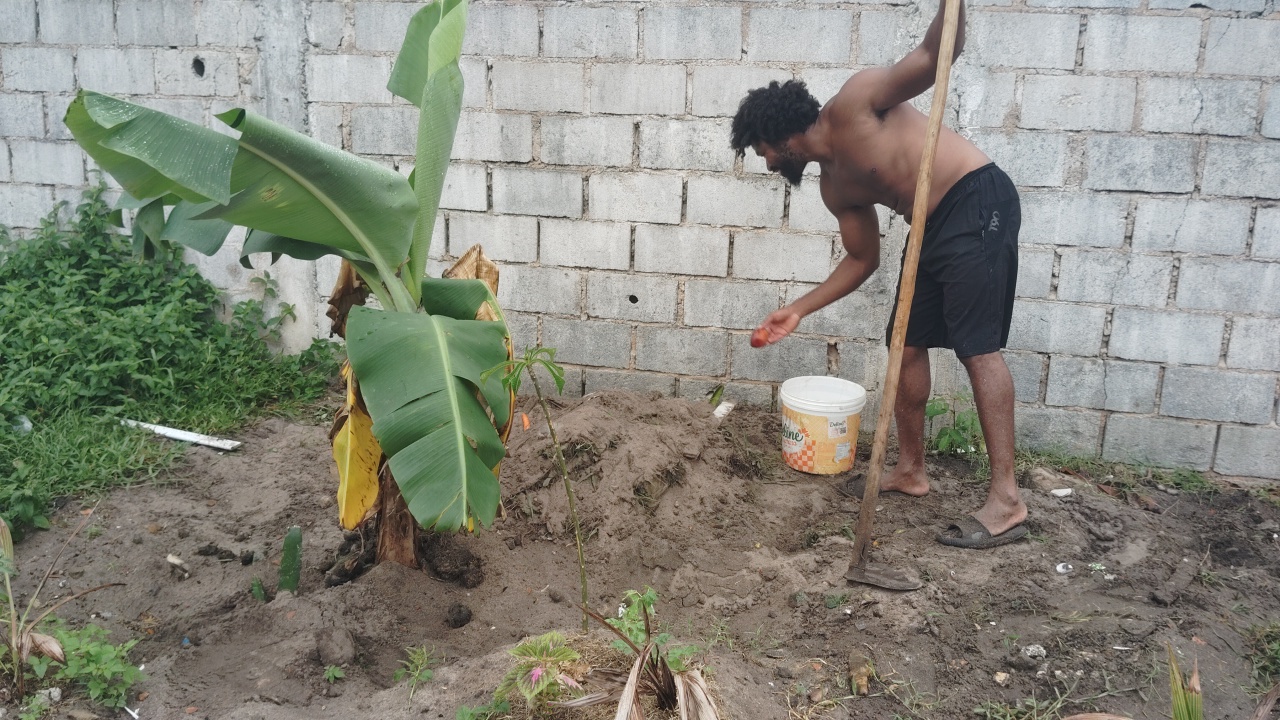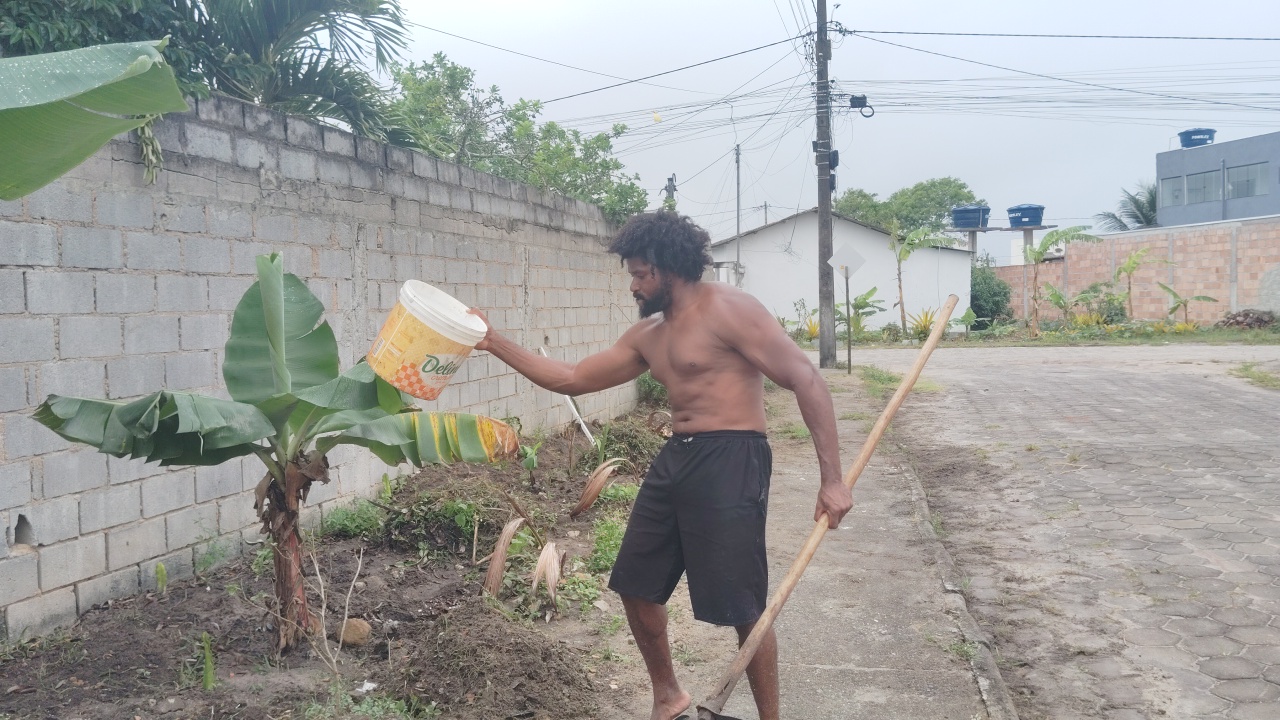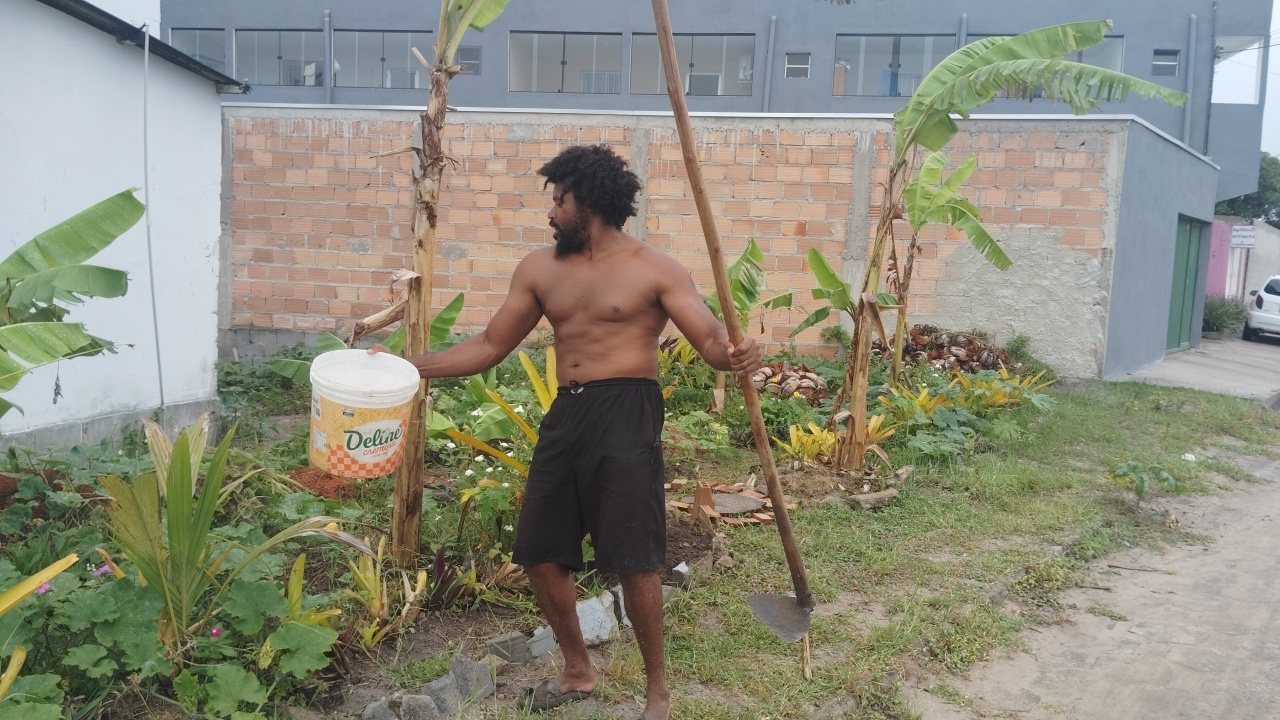
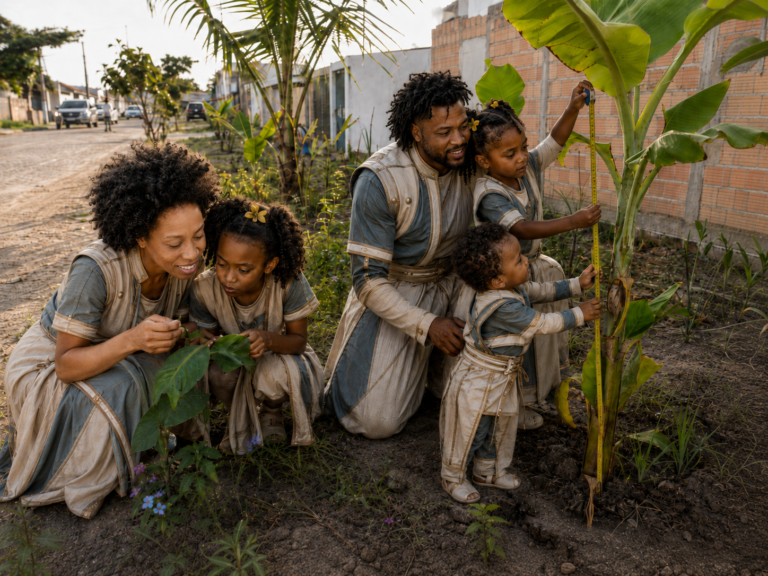
We just started throwing seeds. That was 25 January 2026, on sandy ground beside Avenida Lisboa in Prado, Bahia. My wife Sherika and I took the whole job on ourselves, clearing small places by hand, putting seeds into the ground, watching what was already growing and coming back again and again. A household, some seeds, a roadside strip and plenty of work. That was our grand planting ceremony.
By April we were harvesting. Pumpkins spread over the sand, bananas and papayas gave us food, and our children had new things to inspect practically every time we stepped outside. The food was shared freely. The work behind it was very real.
We are publishing the numbers because a Foodway is a complete living operation. Cultivation is only one part. We moved soil, protected street utilities as carefully as we could, recovered seeds, raised seedlings, watched animals, recorded plant growth, taught young people, wrote research papers, developed software, photographed the work and spent hours explaining the whole idea to people who had never heard of a Foodway before.
A passerby may receive a pumpkin without paying. That pumpkin has still been supported by somebody’s time, skill and resources. Here is what our family has put into it.
What the ledger counts
Our public ledger has a straightforward architecture. Recorded activity covers what our family planted, moved, harvested, shared and worked on. Replacement-value estimates put editable comparison rates on contributed plants, materials and labour. Counterfactual selling models ask what a weekly commercial route would cost if we chose to operate one. Each quantity has a defined unit, period and status, and every activity belongs to its appropriate column. The rules are here at the beginning so readers can concentrate on the life of the Foodway while inspecting the arithmetic whenever they wish.
Where we planted, and how the Foodways grew
Our original Foodway 01 runs for approximately 40 metres by 5 metres, a corridor of about 200 square metres along Avenida Lisboa. These dimensions describe the full streetside working corridor: active planting pockets, deliberately undisturbed vegetation, paths and space for the wider ecosystem. Our earliest cultivated pockets occupied a smaller portion of that ground.
Foodway 02 extends along approximately 50 metres by 5 metres, another 250-square-metre corridor, near the street opposite our original planting. We began placing plants there roughly six weeks and three days before 9 November, starting with ten young coconuts. We brought over 15 papaya seedlings, five tomato seedlings and 15 pollinating plants representing five varieties from Foodway 01. We are still identifying the flowers by name.
One roadside corridor becomes a nursery for the next
Corridor footprints include selective planting islands and living cover; Foodway 03 is currently three banana planting positions.
Three days of selective clearing prepared islands for planting. We leave the surrounding vegetation doing its work. A coconut, tomato, flowering plant and pumpkin may begin in one cleared circle. We usually let that little nucleus establish for about a month before widening the cleared area. Roots, shade and ground cover get a chance to take hold before we disturb more soil.
On 9 November, we expanded with ten more banana plants: seven at Foodway 02 and three at Foodway 03, beside the bus stop near Avenida Lisboa and Itamaraju, spaced about two metres apart. Foodway 03 currently consists of three planting positions rather than a rectangular plot. Across our plantings we now count approximately 35 banana plants and 20 transplanted coconut palms. The ten newly planted bananas are part of the 35-plant inventory, and the ten coconuts at Foodway 02 belong to the 20-coconut inventory. The coconuts are future food producers; the recorded harvest comes from other crops.
Foodway 01 is already working as a nursery for Foodway 02. We record each propagated plant once in the living inventory, then follow it to its new site. That is how the first Foodway can multiply the second with less need for nursery purchases.
What was harvested from April through October
Our original reconstruction shared with VINCYPOWA editor Lance Davis set out the following crop estimates:
| Crop | Period and detail | Estimated harvest |
|---|---|---|
| Pumpkin | April 10 kg; May 12; June 14; July 16; August 18; September 20; October 22 | 112 kg |
| Banana | September approximately 80 kg; October approximately 87 kg in the original account | 167 kg |
| Papaya | About two fruits a month from May to October, averaging approximately 1.5 kg each | 18 kg |
| Watermelon | Approximately one 4 kg watermelon monthly over four months | 16 kg |
| Tomatoes | August 10, September 14, October 18 | 42 fruits (counted individually) |
Four weighted crop groups
313 kg baseline. Tomatoes counted separately as 42 fruits; 3 kg later added to the running report.
Pumpkin, month after month
112 kg reconstructed across the seven harvest months.
The four crop groups recorded by weight total 313 kg. Tomatoes are recorded separately as 42 fruits; we have yet to establish their weight. A possible 12 kg passion-fruit harvest expected later in November remains a forecast, outside the harvested totals.
After our exchange with Lance, our family shared another 3 kg, bringing our running family-reported donation figure to 316 kg. There is one banana detail to settle in the underlying record: we now remember the first transplanted banana harvest as closer to 90 kg, rather than the 80 kg in the earlier reconstruction. We have kept the earlier and later figures on separate lines in the spreadsheet. Counting both would inflate the result.
The large banana harvests are especially interesting because much of their productive growth happened before the plants reached the Foodway. Two donated banana plants, approximately six months old when transplanted, yielded their bunches about one month and six weeks after transplanting. Our later recollection puts the bunches at approximately 90 kg and 87 kg. We are counting the contribution of mature transplanted stock honestly: it arrived with roots, age and productive capacity already established.
We have observed neighbours and passersby taking food, and our household has also eaten from the plants. Our monthly figures are reconstructed production estimates, while the running donation account tracks the food our family reports sharing. Those are separate records, with household consumption and recipient counts retained as their own fields. The next improvement is to record each distribution against the crop and quantity harvested.
The underground water lines shaped our planting design
A streetside Foodway has an engineering responsibility. The ground beside a sidewalk can carry buried water infrastructure, and a misplaced planting pit could leave the family and the neighbourhood with a ruptured pipe. We designed the planting to protect those services.
In Prado the water utility is Embasa. Our working assessment began with visible water-meter positions, the streetscape and Kimroy’s engineering judgement, since a formal georeferenced utility drawing was unavailable to us. Workers familiar with local connections often estimate the route from the meter toward the street and sometimes use an approximate 0.4-metre depth as a field reference. We treat those observations as a preliminary routing hypothesis; formal Embasa confirmation governs any future deep excavation.
So we designed around less disturbance. For bananas and coconuts we commonly bring soil and planting material above grade, limiting our digging to approximately 0.2 metre. Seeds, vines and shallow establishment pockets allow many crops to develop with small interventions in the existing ground. For any deeper work, our operating procedure calls for confirmed utility locations and the appropriate local permissions.
At these specific Foodway sites, buried water connections have been our principal utility concern. Each additional street will receive its own site assessment for water, drainage, cables and other services before planting routes are established.
The preliminary route assessment, selective planting layout and decisions to import soil are engineering labour. A spreadsheet that counts only the price of a seed packet misses that work completely.
Half a tonne of soil, carried in small loads
One of our largest material contributions is ordinary dirt.
We estimate that we have moved about 500 kg of richer soil into the sandy Foodway, by bicycle and by hand, often from a more fertile area near the forested edge of urban Prado, approximately three kilometres away. This spared us some deeper excavation and allowed us to build growing pockets above the sand.
It also led to another research question. When we move soil containing roots, decomposing material and visible soil life, what biological communities come with it, and which survive the move into the hot sandy site? We have observed living material in the transferred soil. Microbial composition and the effects of transfer on biodiversity remain subjects for future sampling and comparison. Our soil collection also operates within land-access, ecological-protection and contamination safeguards.
What would that effort cost if someone hired the job out? Our editable model assumes 20 kg per bicycle load, or about 25 return trips. At six kilometres return, that represents roughly 150 kilometres of travel. The planning allowance of 1.2 hours per trip, including travel, loading and unloading, produces 30 hours of transport labour. The model marks these as scenario assumptions, ready to be replaced with timed journey records.
A published 20 kg retail bag of garden soil costs around R$20, making 500 kg approximately R$500 as a bagged-soil replacement comparison. The material we carried came from a fertile local site and has a different composition and sourcing history from certified retail soil. At the model’s illustrative R$20 per hour for physical field work, hauling represents R$600 of contributed labour. We retain the material comparison and the hauling effort as two distinct forms of value.
Donated plants, seeds recovered from dinner and our multiplying nursery
We have purchased some seeds from our Bolsa Família household money. We also save seeds from the food we buy and eat: pumpkin, melon, papaya and other suitable fruit. When families receive produce, we encourage them to return usable seeds after eating, so a gift of food can become the beginning of another planting.
The public financial model uses an editable planning allowance for purchased seeds. We will enter actual household expenditure as receipts are reconciled. This lets readers distinguish the family’s cash purchases from the modelled value of freely recovered planting material.
The larger living inputs are the transplanted plants. For comparison, Brazilian listings include banana seedlings advertised from about R$15.88 each for certain 40–80 cm plants and dwarf coconut seedlings around R$30 each in Bahia. At those illustrative replacement prices, 35 bananas represent approximately R$556 and 20 coconuts another R$600. These comparisons establish baseline replacement values for young nursery stock. Mature donated bananas arrived with additional productive capacity, which we describe separately from the young-seedling benchmark.
Papaya, tomatoes and flowering plants propagated in Foodway 01 are moved into Foodway 02 as transfers within one growing network. Their propagation and planting labour stays in the work ledger, while the seedlings themselves remain single-counted living assets.
Our earlier field observations include approximately 150 earthworms introduced during a protected trial, along with flowering plants, grasses and ground covers. Those additions have research and ecological interest. The priced plant-inventory model covers counted, comparable inputs; uncounted microorganisms, insect visitors and mixed seed lots belong in the observational record.
The horses eat. They also leave something behind.
The Foodway operates as an open-access growing corridor. Four free-roaming horses visit the area and sometimes help themselves to banana and pumpkin leaves. We estimate roughly 1 kg of leaves eaten every four days since April. Over the modelled April–early November period, that represents around 56 kg of green leaves. This animal-food contribution has its own line, separate from the reported 316 kg of human-food distribution.
The horses also leave manure. Our model tracks one observed or assumed deposited pile per week, averaging 1.5 kg per deposit, or roughly 48 kg during the growing period. This is a fractional, opportunistic contribution from the roaming animals. Separately, we have brought back approximately 2 kg of dry dung each month during visits around Greenville, or 14 kg across the seven completed months from April through October.
We sometimes spend about three hours a week cycling with the children, observing the roaming horses, studying where they graze and bringing useful organic material back. Those combined trips appear once in the labour model, with the horse observation, family learning and dung collection recorded as activities within the same hours.
Horse manure has nutrient value, but fresh manure also brings real food-safety questions. We are recording deposits and decomposing material rather than prescribing fresh manure beside food ready to harvest. Separation from edible produce, appropriate composting and safe handling belong in any larger Foodway standard.
For raw collected dung, the model applies an editable R$0.75/kg replacement allowance, below packaged and treated retail manure. The rate is a planning benchmark for the material’s value and can be replaced when a suitable local comparison is established.
Free labour has a value. So does the engineer, researcher and editor.
Sherika and I rotate the duties. Sometimes one of us is planting while the other is helping the children or writing. Sometimes we switch. The Excel model counts 906 combined household hours across both of us, with an illustrative 50/50 allocation that we can refine against fuller activity diaries.
We estimated the work by activity and period: initial clearing and seed scattering from 25 January; seasonal watering, tending, propagation and harvesting from April; soil hauling; the three-day Foodway 02 clearing; and the ten-banana expansion on 9 November. The model also tracks weekly teaching, observation rides, field notes, public media, manuscript preparation, technical design and Pacorips software development.
906 hours, many kinds of work
Two adults rotate duties. The 906-hour household total covers fieldwork, research, engineering, teaching, software, media and outreach.
As of 9 November 2026, the current activity model totals approximately 906 combined family labour hours. Brazil’s 2026 federal minimum-wage hourly reference is R$7.37, giving those hours a baseline equivalent of approximately R$6,679. The model then values engineering, manuscript preparation and other specialised work separately, using rates suited to the tasks rather than treating every hour as equivalent.
The spreadsheet therefore includes a second scenario with editable rates for physical field work, engineering, research, teaching, software and public communication. These role-based assumptions produce approximately R$30,217 of contributed labour value. With R$1,702 for the modelled replacement value of soil, bananas, coconuts and manure, the Rev1 baseline contributes approximately R$31,919 in economic value. This is a replacement-value model covering time and materials, with actual cash expenditure, land valuation and per-kilogram production costs tracked through separate accounting methods. The Rev2 workbook also records the added dragon-fruit stock.
Actual cash spending has its own column. Purchased seeds are part of it; future entries will cover verified water, connectivity, equipment upkeep and other household expenditure as receipts and records are reconciled.
Research also grows here
The Foodway gives us questions worth taking beyond our family. We are studying soil cover and moisture, plant diversity, food access, crop use, the work behind shared food, and how photographs and observations can become more reliable field evidence. Several manuscripts and scientific conversations are underway; preparing a paper requires reading, checking sources, revising figures and responding to specialist criticism.
Our wider research exchanges include Professor Fábio Venturoli in Goiás, whose expertise in forest inventory, regeneration and restoration is relevant to productive landscapes; James Otieno in Kenya on food availability and dietary diversity; and Dr Erich Midigo, whose work links agriculture, public-health nutrition and households. Dr Midigo’s Ndaloh Heritage Organization has published Sherika’s authored reflection, “From Soil to a Child’s Bowl: A Kenya–Brazil Food Conversation”[1], on its research-and-articles page[2]. We list that contribution as a published essay and track the experimental research under its own manuscript status.
Professor Joe M. Regenstein has engaged with a manuscript on food systems and the useful destinations of food and its by-products. Professor Peter A. Makachia is connected to work on homes, resident-designed environments and the relationship between shelter and productive land. Professor Prashanth N. Suravajhala, based in India, is advising on a separate systems-genomics and family-care publication and on standards for a prospective Living Research format. These exchanges enrich the family’s wider research practice; the Foodway harvest figures come from our own field records.
Each research relationship is identified according to its actual stage: discussion, manuscript preparation, editorial review, authored publication or formal peer review. Authorship is attributed through agreed substantive contributions, with unpublished findings held within their respective collaborations until the contributors approve release.
Why media and software belong in the ledger
A public Foodway stays alive through cultivation and public understanding. People need to know that the food is meant to be shared, that productive plants deserve care, that roots and flowers contribute long before harvest, and that neighbours can help keep the site beautiful and orderly.
That change in public understanding takes work.
We have written to editors, answered questions, prepared photographs, corrected facts, followed up on submissions and explained the Foodway to audiences far from Prado. Published public outcomes include A Lavoura’s interview about productive diversity as soil infrastructure[3] and Sherika’s Ndaloh Heritage contribution. The family’s publishing record also includes Foodway- and Abundance-related articles or editorial contributions carried by FarmingFarmersFarms, The Nigerian Voice, Green Media Africa, Fiji Sun and Jornal Tribuna. These outlets and their publication types are mapped in our coverage and Abundance source maps[4]. Their public coverage records the reach of the work; the harvest measurements are recorded in our own field ledger.
This is why the economic account includes writing, translation, photography, media archiving, outreach and follow-up. A freely accessible article still takes family hours to produce. Publication fees enter the cash ledger when supported by a payment record.
We also use Pacorips as part of the developing local coordination system. We are designing it to organize volunteer cleanup and learning, harvest requests, donations and participation. People who help with the work receive priority, followed by registered families requesting preferred harvests. We have also built software to support records and media. Application development and maintenance have their own engineering costs, even when families use the service for free.
Foodway 01 is already giving us Foodway 02
A useful nursery makes the next site less dependent on buying everything again. That is why the fifteen papayas, five tomatoes and fifteen flowering plants moved from Foodway 01 to Foodway 02 matter. The first site has become a source of living material for the second.
We are learning to let each plant do several jobs: a pumpkin feeds people and covers the sand; a banana can provide fruit, leaves and shade; a flowering plant attracts visitors while making the path beautiful. We have observed these functions in different ways, and we are preparing the comparisons that can show where they are most useful.
The Foodway began with a family throwing seeds. Now it has multiple locations, children learning in the open air, donated food, horses wandering through, plants travelling from one site to another, and a growing scientific and public record.
When a person takes a ripe fruit without paying, the food is free at the point of use. Our ledger shows what went into making that possible. We want others to be able to inspect the work, correct the estimates with better measurements, and see exactly how much knowledge, labour and material a family can contribute when the harvest itself is given away.
Our next record will be stronger because this one is visible.
How to read our numbers
This account is current through 9 November 2026. The Excel workbook has distinct categories for family-recorded observations, reconstructed production estimates, published seller-price examples, modelled labour hours, research in preparation and confirmed publication outcomes. Its editable parameters include hourly rates, trip loads, hours and materials. Readers can inspect the work as an open economic account of contributed capacity, while commercial profitability and certified crop yields require their own dedicated measures.
Selected public references: Brazil’s 2026 minimum-wage decree[5]; banana seedling price examples[6]; Bahia coconut seedling listing[7]; 20 kg soil product listing[8]; Rutgers on horse manure quantities[9]; USDA guidance on manure and food safety[10]; Prado’s water-service profile[11].
Everybody kept saying, “Why don’t you sell the crops?”
Everybody kept saying it. Why don’t you sell the crops? Sell the pumpkins. Sell the bananas. Sell the papayas. There is food growing by the road and somebody ought to make money from it! People say sell as though selling is a magic trick. Harvest in one hand, money in the other, and the farmer is suddenly better off.
Being the scientific person I am, I decided to crunch the numbers for that too.
I have spent years engineering systems with Sherika, and one thing we have learned is that a thing can work beautifully right up until somebody forgets to count all the work that makes it work. We had already calculated what it took to plant, grow, teach, move soil, build software, document research and share food. Now I wanted to turn the picture around. What happens if, instead of allowing the family who needs a papaya to pick it, I insist that every papaya become money first?
The costs start arriving before any customer does.
What the food dollar reveals about commercialization
The cost of growing food is only part of the cost of selling food. There is the harvesting standard demanded by a market, grading, packing, transport, handling, the stall, finding buyers, managing unsold stock, and the farmer’s time spent away from everything else.
There is an extraordinary number in the USDA Economic Research Service’s 2024 Food Dollar accounts[12]. Of every US dollar spent on domestically produced food, an average 11.8 cents went to farm establishments, while 88.2 cents represented the marketing share. For food bought to eat at home, the farm share was 18.5 cents, with 81.5 cents going to the wider chain. These are national spending shares across many kinds of food, including prepared and processed products. Fresh produce has its own pattern: USDA’s product-level figures put the farm share at roughly 39.6 cents for fresh fruit and 26.7 cents for fresh vegetables. The numbers measure where consumer spending goes; our Foodway model separately estimates the labour, transport and handling required for this particular harvest.
But look at how much economic activity can sit after the plant has already done its wonderful job. Even the comparatively short route for fresh fruit asks people to handle it, move it, offer it for sale and keep it in good condition until somebody pays. The cost of turning a crop into money is a serious part of the food system. For our small Foodway, with mixed crops coming ripe at different times, it could be the most expensive part of the entire operation.
Here we can put the global food-dollar picture beside something small and concrete: our own family, our own quantities and our own time. That is where the magic trick starts looking rather expensive.
Harvesting: the papaya suddenly becomes a rare specimen
At present, when somebody requests food through our growing local Pacorips process, we can coordinate collection close to where the plant grows. In some cases people pick their own food, with appropriate care. Sometimes the papaya never leaves the Foodway at all. It comes off the tree and the person eats it there. Tree to belly. Very nearly magical!
If we turn the fruit into retail stock, the story changes. We need to decide what is ripe enough for Friday but will survive until Saturday. We need a harvest plan, containers, somewhere clean to sort, and much more care about the tiny marks that make an otherwise excellent fruit less appealing to a paying customer. A little bruise can lower the price. Fruit that is perfectly good for eating may be rejected for appearance. A tomato becomes delicate cargo. A papaya has to arrive with its skin and its market value intact.
Of course safely harvesting food matters in either system. The difference is the extra commercial standard and the additional hands it must pass through. Embrapa’s banana postharvest guidance[13] describes how knocks mark fruit and how temperature and ventilation affect quality. We would need to manage those risks each time we prepared a sale.
In our selling model we allow one additional hour per market week for commercial harvesting and grading. Across approximately 32 weeks between 1 April and 9 November, that produces 32 hours. At an illustrative R$20 per hour, the extra work carries R$640 in replacement value before the produce is packed. The allowance is editable, with actual harvesting observations available to refine it in a future selling trial. For our family, that same time can otherwise go into growing, sharing and teaching.
Packaging: the belly is the best papaya bag I have seen
Then there is packaging. Boxes, crates, bags, liners, cleaning, storage and the job of remembering which containers need to come home. The market pays attention to what a product looks like before it is bought. Papayas bruise. Tomatoes squash. Bananas need air. Pumpkins are wonderfully stubborn by comparison, but they are also heavy.
A Brazilian supplier lists a 33-litre reusable produce crate for approximately R$40[14]. Another advertises 100 thin shopping bags for R$7.68[15]. Those are public price examples for the model. Three reusable crates therefore represent about R$120 in starting equipment and one hundred bags roughly R$8, with delivery and other supplies assessed separately. Washing, drying and returning crates also take time. The model assigns one additional hour weekly for sorting, packing and post-market cleanup, or 32 hours / R$640 of contributed labour.
Compare that to the papaya eaten beneath its own tree. I love that example. The belly is the package. The food goes home in a digestive system. A larger harvest may travel home in a family’s bag or container, with the same ordinary care for cleanliness. The immediate tree-to-belly route eliminates commercial wrapping, crates and repeated handling, along with the bruising that can come with them.
Transport: five kilometres to Mercado Municipal São Sebastião
Our home is approximately five kilometres from the market route we would use. The model sets a ten-kilometre round trip, based on our family’s route estimate, which can be updated with a measured journey.
The venue is Mercado Municipal São Sebastião, in Prado’s São Sebastião neighbourhood. The Prefeitura de Prado describes its renovated market and vendor boxes[16], and the market has hosted municipal family-agriculture events[17]. Our family experiences the regular local feira as a Friday-afternoon-to-Saturday gathering. Special events use separately published hours, so the schedule in our model follows our family observation pending official confirmation.
Anyone who has visited a Brazilian feira knows its pleasures: neighbours greeting one another, fresh produce arriving in crates, people asking how much, choosing their bananas, bargaining a little, and returning home with the weekend’s food. We enjoy that public life. Running a stall is another matter. Before the selling starts somebody must load the fruit, keep it from bruising on the road, unload, set up, then pack everything back up. One fruit box may be manageable on a bicycle; a load of bananas and pumpkins is another story.
For comparison, the Excel model uses one ten-kilometre car round trip per week, a vehicle averaging 12 km per litre and gasoline at an illustrative R$6 per litre. Over 32 trips, that is roughly 320 kilometres, 26.7 litres and R$160 in fuel, with maintenance and depreciation tracked as possible additional inputs. Bicycle delivery is another scenario, with fuel savings accompanied by its own loading and travel requirements.
The stall has a price before the first sale
The municipal market is public space administered through permissions and commercial arrangements. Prado’s municipal government has described permission holders (permissionários), boxes and kiosks at Mercado São Sebastião. The current fee schedule and full ordinary-stall application procedure need confirmation from the municipality. Our model therefore keeps Prado’s official fee field open and uses a separate, visibly hypothetical charge for comparison.
For an example of formal registration, we can inspect São Paulo, where we lived before Prado. Its official Tô Legal feira-livre service[18] uses a Termo de Permissão de Uso for eligible market trade, with municipal registration, allocated spaces, applicable health requirements, public-space charges and renewal procedures. Those are São Paulo’s rules. We use them to identify administrative steps for a selling operation while seeking Prado’s own current requirements.
For the Prado scenario, the municipal verification list is clear: confirm whether an ordinary vegetable seller may use a box, how vacancies are assigned, what documents and handling standards apply, and the 2026 fee. The model uses eight hours of administrative work and an editable R$25 weekly stall allowance, which produces R$800 across 32 weeks. That rate is a planning assumption, awaiting the Prefeitura’s published or written answer.
The paperwork, queue, trip to the office, payment, return visit, renewal and possible stall equipment all belong to the selling workflow. They begin consuming time well before the farmer makes the first real sale.
Three hundred and sixteen kilograms spread across thirty-two weeks
“Sell 316 kilograms!” sounds tremendous until you take out a calendar.
From 1 April through 9 November 2026, including both dates, there were 223 days, or 31.86 weeks. Divide our family’s 316 kg running total across that period and the mean is about 9.9 kg each week. The original April–October production reconstruction recorded 313 kg across four weighed crop groups; our later account added 3 kg of sharing. Tomatoes remain recorded as 42 separate fruits. That average is a planning measure of volume across time, while the detailed crop ledger preserves how the food was grown and shared.
And those 9.9 kg arrive in the unpredictable rhythm of living plants, rather than a tidy crate of ripe tomatoes every Friday. One week brings pumpkins, another a few papayas, and another may have a gap in a particular crop. Two large banana bunches came from mature donated transplants, bringing a surge followed by an interval. This is wonderfully convenient for direct sharing whenever food is ready. A steady commercial market stall asks for a more regular inventory than the plants provide.
A customer who buys tomatoes from me today may come back wanting tomatoes next Saturday. What am I going to tell her when this week’s tomatoes are still green and my best offer is a pumpkin? She may sensibly buy from a vendor with a steadier supply. Now I have lost a hypothetical regular customer I never possessed in the first place. I still have to pay for the stall, transport and time whether I sell a pumpkin or spend the whole morning explaining why there are no tomatoes.
A weekly average is only the starting point for commercial arithmetic. The selling model needs saleable kilograms, realistic prices, spoilage, operating expenses and the hours required to earn the receipts. We expose those inputs in Excel so that anybody can test a different market route.
Marketing: the next job is convincing somebody to buy
Selling also wants customers. We already spend hours photographing the Foodway, talking with scientists, responding to editors, documenting plants and changing public understanding about our open-access landscape. That work belongs to the original ledger as public education and project communication. Weekly sales marketing would add a different job: finding buyers in time to clear a stall before the fruit softens.
Imagine redirecting those hours into advertising our Saturday pumpkins. Photograph the fruit, make a post, answer messages, negotiate prices, explain which corner of the market we are in, remind buyers, receive cancellations, and do it again next week. This time the audience is chasing a price, while I am chasing buyers. For our model, one hour of sales marketing each week over 32 weeks represents 32 hours, valued at R$800 at an illustrative R$25 per hour.
Could we outsource that? A Brazilian marketing agency’s 2026 price guide lists freelance social-media services beginning around R$500 per month[19]; paid advertising adds another charge. Across a hypothetical seven-and-a-third-month season, even an entry-level R$500 monthly service reaches about R$3,660, a substantial comparison for an irregular small harvest. It would be absurd to build a marketing machine just to move a few papayas. Our workbook lets the operator select family-run marketing or a paid-service alternative, counting the chosen method once.
There is an even less visible cost. Teaching our children to recognise plants, inviting neighbours to use the Foodway, and showing communities what can grow along a street can multiply the Foodways themselves. Sales marketing chiefly serves the next sale. Both kinds of communication have a place, but they create different returns, and both draw on time and skill.
What about the weekends we would lose?
Here is where the spreadsheet gets personal.
Keilah attends the Escola Municipal Professora Maria Helena Gonçalves Salles. Kaleeyon’s preschool is the Escola Municipal Benjamim Pereira Mascarenhas. During the school week there is already plenty happening. We do the school runs, care for our little boy, cook, work on our projects, move through our household routines and spend time together. When the weekend comes, that is our family time. A walk, the beach, swimming, play, reading, doing nothing much together. What a lovely thing, doing nothing much together!
Now imagine Daddy leaving every Friday to prepare a stall and every Saturday to sell whatever happens to be ripe. He has to explain to Keilah and Kaleeyon why the weekend no longer belongs to the family. If we both run the stall, the children either come into the business operation or somebody else must care for them. If one parent goes, the other carries more family work. The product may be cheap, but the day it consumes is precious.
The model assigns eight hours per market week to attendance and selling, or 256 hours over 32 weeks: 32 eight-hour days. At an illustrative R$20 hourly rate, the selling work carries R$5,120 in replacement labour value. The hours are also recorded as family time at risk, a human consequence distinct from the wage calculation.
The spreadsheet can price a market shift. A laugh with Keilah, a beach afternoon with Kaleeyon, the hours my wife and I get to spend together: those belong in a different column, called life. The workbook shows 256 hours of family availability at risk as a separate, unpriced measure. Those same 256 hours appear once in the labour valuation; their place in family life is described alongside the number, free of a second financial charge.
Free food protects a great deal of that time. Neighbours can collect produce when it is ready, and Pacorips can coordinate requests and participation. We give labour and we monitor plants, safety and the site. Our design allows weekends to remain available for family life instead of turning every harvest into a market shift.
The food that returns from market
This is the saddest part of the hypothetical market day. Suppose I return with tomatoes, ripe papayas and bananas still in their boxes. The fruit has been picked, handled and driven around. The next decision is what to do with food that has already left the plant.
People say, “Put it in a freezer.” A freezer can preserve food for particular uses, but the temperature needs of whole bananas, tomatoes and papayas differ. The Embrapa guidance on banana[20] puts suitable chilled banana storage near 14°C; Embrapa’s tropical-fruit guidance[21] distinguishes temperatures and shelf lives by crop. Some fruits can be prepared and frozen for later cooking or processing. Pumpkins can last longer in appropriate dry storage. The fresh-market route therefore requires crop-specific temperatures, safe handling and a plan for the food’s next use.
A 197-litre Electrolux chest freezer has been listed around R$1,899[22], a concrete capital-price comparison. For fresh mixed produce we would choose equipment according to each crop’s actual storage requirements. The model tests a 30 kWh monthly refrigeration allowance at an illustrative R$0.95/kWh. Over 7.3 months this produces about R$208 in electricity, alongside the separately listed appliance purchase, upkeep, cleaning and suitable storage arrangements. It also shows an allocation of the appliance price over five years so capital cost and seasonal operation remain distinct.
Even with good storage, fruit can return from market and deteriorate before another selling day. Our scenario tests a 10% unsold or spoiled share, or 31.6 kg of a 316 kg marketing volume. At a modelled R$5/kg, that is R$158 of potential receipts at risk. The percentage is an editable stress test for a retail route, to be replaced with actual loss records if we ever operate one.
And then comes the dreadful logic of it: because I could not sell the food to buy what I need, I discard the food and prevent somebody else from eating it too. If I can’t eat, neither can you. How did we ever become comfortable with that? Our Foodway chooses the earlier route: a person can take the food while it is fresh. Timely donations, preservation, processing and other safe uses can also keep edible harvests moving when retail demand falters.
The environment pays for the sales journey too
A farmer may pay for gasoline and electricity. The atmosphere receives the exhaust. There is the road trip, the cooling equipment, the bags and cartons, washing water, damaged food and possibly disposal transport. Each physical flow has an environmental consequence alongside its financial price.
Let’s calculate one modest sales route from our editable assumptions. Thirty-two ten-kilometre return trips cover 320 km. At 12 km/L, a vehicle uses about 26.7 litres of gasoline. The U.S. EPA reference factor for combustion[23] is about 2.35 kg CO₂ per litre, giving approximately 63 kg CO₂ in tailpipe emissions for this hypothetical route. This number represents fuel combustion alone; vehicle manufacture, the particular fuel blend and the Foodway’s actual bicycle activity sit in their own categories.
The market journey has an exhaust pipe
Transportation and cooling alone produce a partial estimate of approximately 72.7 kg CO₂ in this hypothetical selling route.
A storage appliance operating at 30 kWh a month for about 7.3 months would consume roughly 220 kWh. Applying the 2025 Brazilian grid-emission comparison factor of 0.0461 kg CO₂/kWh[24] produces around 10 kg CO₂ in modelled electricity emissions. With the vehicle example, the partial fuel-and-electricity total is about 73 kg CO₂, before material manufacture, vehicle upkeep, packaging disposal and food-waste treatment. Each new lifecycle boundary can be added as data becomes available.
One hundred plastic bags weighing 5 grams each would put half a kilogram of plastic material into the packaging route if used once. Reusable crates carry an initial manufacturing burden and can serve repeated market days. A 10% unsold-food case places 31.6 kg of produce at risk, with the resources used to grow that food already committed. We track packaging mass, travel, storage energy and unsold food as separate flows. Waste-treatment emissions will depend on whether leftover food is eaten, processed, composted, fed to animals or sent to landfill.
The wider research literature recognises losses at harvest and along the supply chain. A Brazilian review of postharvest fruit and vegetable studies[25] found that published loss percentages vary with their definitions and evidence. Our preferred method is to measure each stage of our own route and publish the specific conditions behind every loss estimate.
Our free route also uses resources: bicycle travel, water, planting labour, software and visits. Those activities appear in the first ledger. The selling comparison isolates the extra journeys, cooling demand and handling stages created when each kilogram must pass through a commercial transaction.
We tried the selling calculation in the spreadsheet
To examine when selling costs can outweigh a small mixed harvest, we built a counterfactual market scenario with 32 weekly selling sessions. It is a model of an alternative we could have operated. Actual Foodway activity stays in the original operations ledger, allowing a clean comparison between the two routes.
| Scenario item | Working assumption | Indicative value for 32 weeks |
|---|---|---|
| Commercial harvesting and sorting | 1 extra hour/week × R$20 | R$640 |
| Packing, crate washing and handling | 1 hour/week × R$20 | R$640 |
| Transport and loading labour | 1 hour/week × R$20 | R$640 |
| Working the market stall | 8 hours/week × R$20 | R$5,120 |
| Family-run sales marketing | 1 hour/week × R$25 | R$800 |
| Administration and applications | 8 hours once × R$25 | R$200 |
| Illustrative stall charge | R$25 per week | R$800 |
| Fuel for 320 km | 12 km/L × R$6/L | R$160 |
| Three reusable produce crates | R$40 each | R$120 upfront |
| One hundred shopping bags | R$7.68 per 100 | R$7.68 |
| Refrigeration electricity, if installed | 30 kWh/month × 7.3 months × R$0.95 | about R$208 |
| Refrigeration equipment | Example purchase price R$1,899; recorded as capital separately from 32-week operation | R$1,899 purchase |
Sell the harvest? Run the numbers.
The 32-session market-stall scenario uses assumed prices and attendance. It is a comparison of routes, rather than a record of sales.
Before the refrigeration capital purchase, these assumptions produce about R$9,336 in added labour and operating costs for a weekly stall. The workbook separates equipment purchase from allocated capital cost. The original 906 hours belong to the actual Foodway; the selling hours form a separate scenario. Family-run and agency marketing are alternatives, so the model counts whichever option is selected.
What income would we be chasing? At an illustrative R$5/kg retail price and an illustrative 10% unsold share, 316 kg would generate R$1,422 in hypothetical gross receipts across the period. Real prices, harvest timing and buyer access can change this result. Steady high-volume vendors can spread fixed costs over many kilograms; occasional home sellers can sometimes bypass a stall entirely. We are examining a narrower decision: what happens if our small, mixed, freely shared harvest is required to support a weekly market operation?
The numbers say: stop imagining that the mere act of charging money creates a benefit. First establish the route, the customer, the hours, the yield and the costs. Then compare them with the life we already have.
Selling would begin telling us what we are allowed to plant
There is another cost, and it would show up in the garden before anybody saw it on a bank statement. The more we depend on sales, the more we are tempted to plant what we already know buyers want. A promising plant with an unfamiliar flavour becomes a risk to the Saturday stall. A slow-growing tree may look like a poor investment when the next fair wants something ripe now. Plants that enrich soil, provide shade or feed pollinators become difficult to explain in a price ledger.
Our family has a different list of questions. What will survive in this sand? What will shade it? Which roots seem to do well near the ground cover? What flowers bring insects? What plants can we move to Foodway 02? Which new fruit might our neighbours enjoy if they get the chance to taste it? What can our children learn here?
We recently remembered another part of the living stock missing from our first cost account: 30 donated dragon-fruit (pitaya) transplants, about 10 centimetres tall on average, and four passion-fruit vines raised from seed. These are additions to the living plant inventory, with future fruit handled in later harvest records. The pitaya transplants also have replacement value. Public Brazilian listings range widely, from a kit of ten small plants advertised around R$82[26] to individual 15 cm plants priced near R$30. Our baseline for small donated plants is R$8.22 each, about R$247 for thirty. The price and supplier example remain editable in the workbook. The four passion-fruit vines grew from recovered seed, already represented in the seed-origin planting record.
We also have lime seedlings and lime trees in our planting priorities, alongside other useful plants that may attract little interest at a Friday market. Prado’s coastal weather can be dry and dusty. In our household, we have sometimes squeezed a lime, added a little sugar and watched a child’s cough seem to ease within a few minutes, at times around four. This is our family’s observation about the timing of an episode. The cause of the relief is an open research question, and children’s respiratory symptoms still call for suitable medical attention when needed. Any healthcare-cost comparison would require clinical and expenditure records.
That experience helps explain why we keep useful plants close to home. A lime may become a cooking ingredient, a source of seeds, something fragrant beside a path, a plant the children learn to care for, and part of our family’s day. Healthcare decisions are governed by medical need. The wider research question is whether a diverse, accessible food landscape produces household benefits that a narrow crop-sales ledger leaves out.
A lime tree, a household cough and the public health bill
There is a reason I keep coming back to that lime. We live in a dry, dusty seaside town where our children sometimes develop coughs. We have cut a lime in half, squeezed the juice into a little cup with sugar and offered a couple of spoonfuls. On occasions we remember, the coughing seemed to settle within around four minutes. I am describing what we saw in our own home. The effect of lime, natural variation in coughing and differences between illnesses would need comparative study. I want such family observations to become worthwhile research questions, while medical assessment and proven treatment continue to guide care, especially for persistent or serious symptoms.
Now widen the cost question. Medicine dispensed through a local Unidade Básica de Saúde (UBS) can be free to the family receiving it. Professionals’ time, procurement, storage, logistics and federal, state and municipal contributions make that possible. The Ministry of Health explains the financing of basic pharmaceutical assistance[27]. In 2024, the federal ministry reported R$1.8 billion in primary-care pharmaceutical assistance spending[28]. That is a national system expenditure across many patients and medicines, illustrating the real provision required behind free access.
The retail price of a 120 mL guaco cough syrup[29] has been listed around R$22 or more, depending on product and pharmacy. A government procurement price and a patient’s appropriate treatment follow different records. Our health-cost ledger would therefore use documented illnesses, clinical recommendations, medicines dispensed, outcomes and verified purchase costs. A household observation helps us decide what questions to study; medical evidence establishes what a treatment can do.
This is the valuable point for the Foodway: food planting has destinations beyond a market stall. A lime may become dinner, a drink, preserved zest, seeds for the nursery, shade beside the route and a practical question for researchers. A child who learns where the lime grows has gained capability whether anybody charges for the fruit. Wider benefits to nutrition, health and public services deserve their own records and careful comparison. We want a ledger broad enough to reveal them.
If we planted only what would sell most easily next weekend, we would narrow the possibilities to what nearby buyers already recognise. Our current planting style gives us freedom to explore unfamiliar fruit, shade, ground cover, seedlings for new Foodways and children’s learning. GDP can see a sale. Our broader ledger can also see the child growing a new fruit, the soil covered by a vine, and the neighbour tasting something unfamiliar for the first time.
The farmer needs a good life. The family needs the food.
People often defend the sale by saying, “A farmer must eat.” Of course a farmer must eat! So must the farmer’s children. The farmer needs housing, clothing, tools, repairs, transport, time with a spouse, good recreation and the chance to go somewhere beautiful with the family. Our civilization design takes the grower’s need for a good life seriously, right alongside the household receiving the harvest.
The trouble begins when the farmer’s access to those things depends entirely on whether every papaya sells before it spoils. We are developing a larger system in which food contributions are recorded and fulfilled through tangible provision: tools, materials for the home, an electric vehicle, help with care and a family vacation. These returns rely on actual people, materials, service capacity and coordinated delivery. Building those supply arrangements is part of our continuing work through Pacorips and Trott Bailey Family Civilization.
At Foodway 01, we are already testing one useful part of that idea: the plant produces, a person who needs food can get it, and our family records the labour and resources required to make the gift possible. Foodway 01 supplies seedlings to Foodway 02. Neighbours can help clean and learn. Children grow familiar with where food comes from. A person can eat a papaya beneath the tree.
Perhaps the most powerful part is that the sale is optional. A farmer can still choose to sell at market. Markets are lovely places, and well-run commercial farms are useful. The Foodway gives each harvest another immediate destination: a person who needs to eat. Its useful life can begin at the plate, and any financial transaction becomes an additional choice.
Everybody kept asking why we didn’t sell the crops. I wanted to know what selling would cost us: money, fuel, packaging, hours, weekends, plant diversity, and possibly food itself.
Now the question I would ask back is wonderfully simple: Why spend so much time trying to turn a pumpkin into money when it can already become dinner?
System Parameters and Counterfactual Modeling
This extension was prepared 10 November 2026 using the Foodway record through 9 November 2026. It models an alternative 32-week retail route with editable assumptions for market attendance, crop prices, stall charges, transport, refrigeration, marketing and unsold produce. These values describe a counterfactual business, while the Foodway ledger records actual family cultivation and sharing. Public supplier listings establish comparison prices; local quotes and verified expenditures are entered in their own fields as they become available. Earlier production estimates include household consumption, the live plant inventory includes 30 pitaya transplants and four seed-grown passion-fruit vines, and projected future crops enter the harvest ledger only when harvested.
For editors, researchers and curious neighbours, the Excel workbook exposes the inputs, formulas and cited comparisons. Its core accounting rules are simple: actual cash payments require payment records; contributed labour has its own replacement-value calculation; plants and fruit are counted once; and the hypothetical market business is kept separate from the Foodway we actually operated. These parameters let readers test different assumptions while keeping the family’s real work visible.
What does the Trott Bailey Family get out of all this?
Everybody keeps asking what we get from giving food away. Well, we are innovators, and the most amazing part of innovation is seeing the innovation come to life. Something that once existed in our heads is now growing beside a street in Prado. Somebody picks a papaya, eats it there, and carries on with the day. There it is. The idea is alive!
Since Sher and I met and married in 2013, we have been studying family life. We have looked at what it takes for a husband and wife to make a home, raise children, stay together, enjoy each other and have the time and resources to live beautifully. Food, land, shelter, travel, education, useful work, health, and all the little practical things that make up an ordinary Tuesday. Our research has grown into Trott Bailey Family Civilization, with systems intended to make the necessities and delights of life freely accessible.
That work also led Sher to create World Ruler Sherika[4], our algorithmic evaluation of the world’s wealth in Abundance. The name is wonderfully literal. For a very long time people have been measuring the world with the ruler of money and GDP. Sher decided to bring out another ruler. 📏 Hers measures abundance and people’s access to it. We ask what a country can produce, what its families can actually reach, what gets in the way, and whether that capacity can keep growing. World Ruler Sherika examines sixteen categories. We could spend all day talking about them, but we are standing in a Foodway, so let’s begin with food.
Our premise is that money and GDP are obsolete as the rulers of human wealth. A sale enters the GDP ledger. A child picking a ripe papaya and eating it beneath the tree may produce no sale at all. Yet there is food in the child’s belly, a useful plant still growing, and a family with one less thing to buy. Which event has made life richer? This is the kind of question Sher built her ruler to measure.
Food is the foundation of our Free Principle. Once food can reach people freely, the effects spread. A household has one less recurring expense. The money it would have spent on food becomes available for something else. Parents gain room in their week, children learn to grow what they eat, neighbours help raise more seedlings, and the first Foodway begins supplying the second. A pumpkin gives food, seeds and ground cover. A banana gives fruit, leaves and new planting material. Things begin to multiply. We are studying how far those effects reach, and what labour, coordination and provisioning each new step requires.
A free civilization is possible when labour is contributed, capacity is planned, and resources are organized to reach people. The food arriving freely in somebody’s hands has a whole support system behind it. We have spent months laying out that system in actual soil. The labour and material costs in this article are part of the design. We want them visible because every future Foodway needs people who know what the work involves and can improve upon it.
And what has our family gained in Prado? We have gained the joy of doing something useful together. Sher and I take turns planting, clearing, writing, measuring and tending. Our children see the plants grow and the harvest reach other people. We get to watch a first site become a nursery for another. We gain new questions to research, practical knowledge from each mistake and success, and the pleasure of seeing people take food home without a cash register standing in the way. We also gain time together. The hours that could have been swallowed by a weekly market stall remain available for our marriage, our children and our family life.
There is a scientific return too. The Foodway gives our ideas a place to meet empirical data. We can count plants, estimate harvests, record food shared, measure labour, compare material inputs, document changes in the soil and put alternative selling arrangements through the same calculation. The results we have recorded already show real food reaching people through a freely shared route. They also give us better questions for the next season. Our research manuscripts, collaborators, public records and editable spreadsheets are ways of making that work more open to inspection, criticism, improvement and replication. We want science that people can walk through with their children.
That is how we intend to lead wider adoption. The Foodway is already travelling through photographs, articles, interviews and research conversations. Ideas can cross an ocean before a single seed does. Our physical pilots are growing here in Prado, from Foodway 01 to Foodway 02 and the new bus-stop planting. We want to help families and local authorities establish their own Foodways on suitable streetsides, school grounds, parks and government properties, across Brazil and eventually around the world. Each place will have its own soils, underground services, rainfall, plants, people and permissions. Local knowledge and careful planning will shape what grows there. The shared principle is simple: build productive capacity where people live, organize the work, and let the harvest reach them freely.
Global adoption can grow organically in both directions: from one community learning about a Foodway through a publication, and from one successful planting sending seeds, skills and confidence into the next. We want the research to travel, the plants to multiply and the people who do the work to enjoy abundant lives as well.
So what is the benefit to the Trott Bailey Family?
We get to live inside an idea we once only imagined. We get to test it, correct it, raise our children around it and see it feed somebody. We started in 2013 by studying what makes family life good. Now a piece of that thinking is growing pumpkins and bananas beside Avenida Lisboa. For us, that is an extraordinary return. And we intend to keep growing it.

 and then